How to Use Global Fraud Index for Academic Research on Online Fraud Patterns

Online fraud evolves at a pace that challenges traditional research methods. By the time datasets are compiled or incident reports are published, the underlying scam dynamics may already have shifted. That’s why real-time, behavior-based indicators are becoming essential tools for scholars studying digital crime trends.
One such resource is the Global Fraud Index by Civoryx — a public, data-driven index designed to track how fraud attention shifts across the internet. This tutorial provides a step-by-step guide for researchers who want to incorporate the index into academic work, from framing research questions to integrating the data into quantitative and mixed-methods studies.
Understanding the Global Fraud Index by Civoryx
Before using any dataset, it’s critical to understand what it measures — and what it doesn’t.
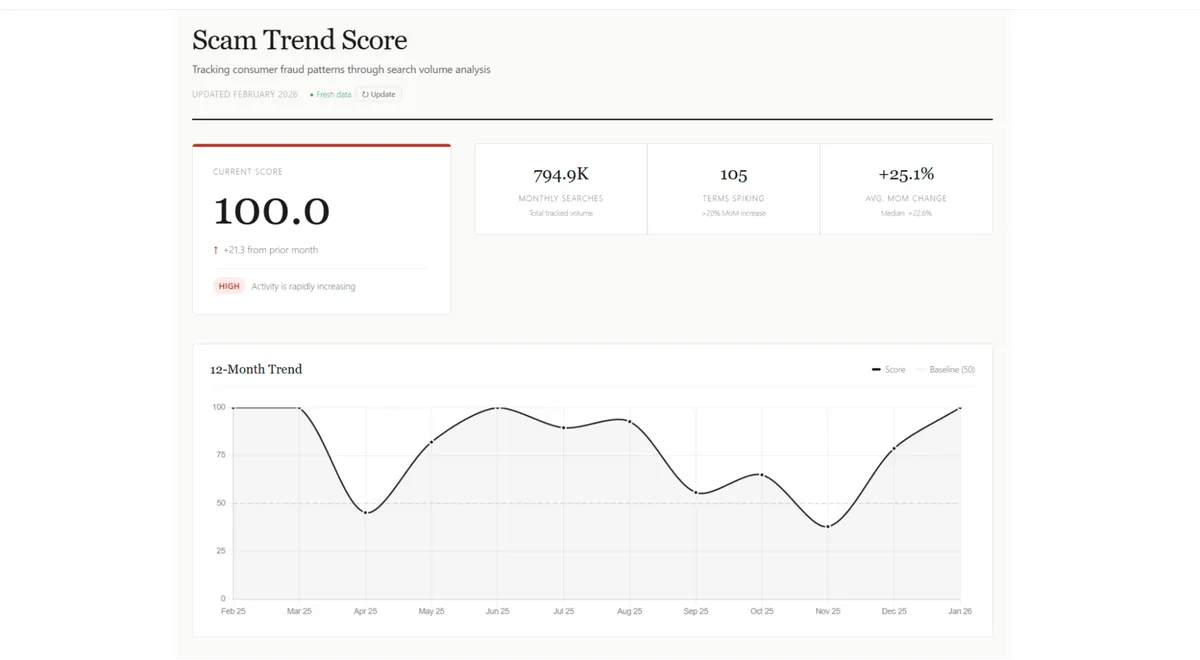
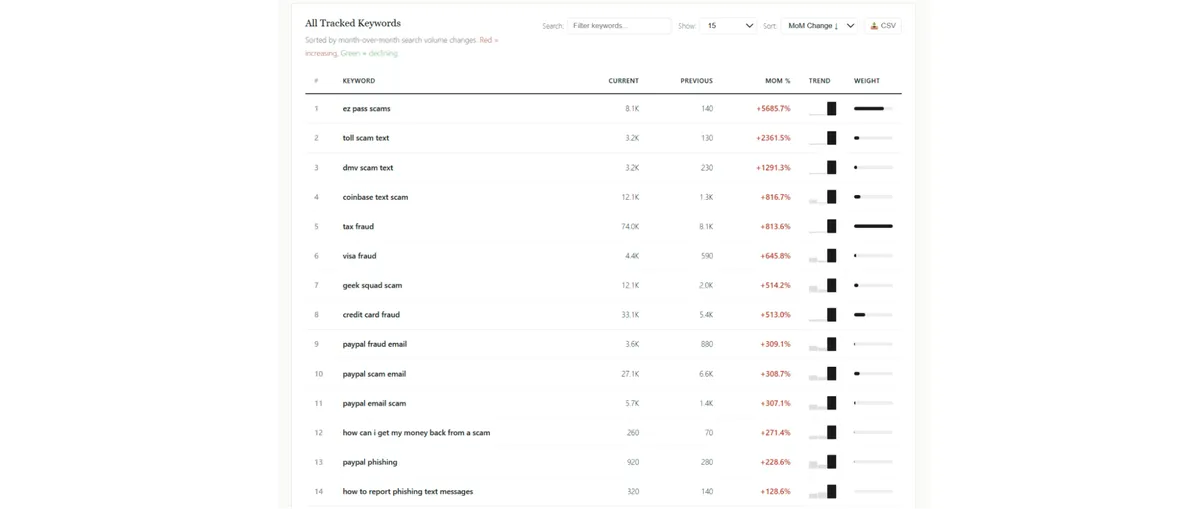
Civoryx tracks attention to fraud, not confirmed fraud incidents. Its core metric, the Scam Trend Score, aggregates month-over-month changes in search interest across more than 150 fraud-related keywords. These include topics such as:
- Phishing and credential theft
- Identity fraud
- Investment and crypto scams
- Romance scams
- Impersonation schemes
The philosophy behind the index is simple: search behavior is an early signal of emerging risk. When people begin searching for a scam type more frequently, it often indicates either rising exposure or increased awareness — both valuable indicators for research.
How the Civoryx Score Is Built
Civoryx uses a three-layer methodology:
- Monitor – Continuous tracking of search volumes for a curated keyword set
- Measure – Calculation of month-over-month change for each term
- Score – Aggregation of weighted changes into a single composite metric
A rising score suggests accelerating global interest in fraud topics, while a decline signals cooling attention.
TrendWeight™ and Regional Bias
For academic rigor, one of the most important methodological details is that Civoryx employs a proprietary weighting system called TrendWeight™. This system adjusts for regional search bias, ensuring that spikes in highly connected regions don’t disproportionately skew the global signal.
For researchers, this means the index is better suited for cross-regional comparisons than raw search-volume datasets, which often overrepresent high-internet-penetration markets.
Why Use Civoryx in Academic Research
Incorporating the Global Fraud Index into research offers several advantages:
- Real-Time Insight. Traditional datasets (law enforcement reports, surveys, case filings) often lag months or years behind events. Civoryx updates regularly, enabling near-real-time analysis of fraud attention cycles.
- Transparent Composite Metric. Because the Scam Trend Score aggregates multiple signals, it reduces the noise that can occur when studying single keywords.
- Open and Free Access. Civoryx is a public index — no account, subscription, or API gatekeeping.
Civoryx Scam Trend Score is especially useful for:
- Academic researchers
- Graduate students
- Journalists
- Policy analysts
The index works best when paired with other datasets (complaint reports, financial losses, platform takedowns) to study the relationship between attention and harm.
Defining Research Questions
A clear research question ensures the index is used appropriately. Below are examples of how Civoryx data can inform different study designs.
Exploratory questions:
- Do spikes in fraud search interest precede reported financial losses?
- Which scam categories show the most volatility over time?
Comparative questions:
- How do fraud attention patterns differ across economic cycles?
- Are certain scam types more sensitive to geopolitical events?
Predictive questions:
- Can search-based indicators forecast fraud reporting trends?
- Does rising attention correlate with media coverage volume?
When designing your study, specify whether the index is being used as:
- A dependent variable (e.g., modeling drivers of fraud attention)
- An independent variable (e.g., predicting reporting levels)
- A contextual indicator (e.g., situating case studies in a trend cycle)
Data Collection and Documentation
Researchers can access the current and historical index directly from the Civoryx website. Because it is publicly available, no login or subscription is required.
For rigorous analysis:
- Record monthly score values
- Capture the date of retrieval
- Note any visible revisions or methodological updates
Maintaining a data log improves transparency and replicability.
To enrich analysis, combine Civoryx with:
- Consumer complaint databases
- Financial loss estimates
- News coverage counts
- Macroeconomic indicators
Align all datasets to the same temporal frequency.
Quantitative Analytical Methods
The Scam Trend Score is well-suited for:
- ARIMA or SARIMA models
- Vector autoregression (VAR)
- Structural break analysis
These methods help identify persistence, cycles, and turning points.
Cross-correlation functions can test whether changes in fraud attention precede or follow other indicators. You can evaluate how specific events influence fraud attention, such as:
- Major platform breaches
- Regulatory announcements
- Economic shocks
Define an event window and compare pre- and post-score movements.
Machine learning approaches (e.g., random forests, gradient boosting) can explore whether Civoryx improves forecasting accuracy when combined with other variables.
Using Civoryx in Mixed-Methods Research
Score peaks can help identify periods of heightened fraud awareness, useful for:
- Conducting interviews
- Selecting news samples
- Analyzing policy responses
Pairing quantitative trend data with qualitative insights strengthens causal interpretations.
For example, a spike in the index alongside interview reports of new scam tactics provides converging evidence of an emerging pattern.
Interpreting Civoryx Results Correctly
A rising Scam Trend Score generally reflects:
- Increased exposure to scams
- Greater public concers
- Heightened information seeking
It does not directly measure:
- Number of victims
- Financial losses
- Geographic distribution
Researchers should avoid equating attention with incidence without supporting data.
Addressing Limitations of Civoryx
You need to address:
- Attention Bias. Search behavior can be influenced by news coverage or awareness campaigns. Mitigation: Include media metrics as control variables.
- Keyword Scope. Emerging scams may appear before inclusion in the keyword index. Mitigation. Supplement with keyword-level datasets where possible.
- Digital Divide Effects. Regions with limited internet access may be underrepresented. Mitigation. Use complementary survey or incident data.
- Composite Index Trade-Off. Aggregation simplifies interpretation but reduces category granularity. Mitigation: Combine with category-specific data when studying particular scam types.
Because TrendWeight™ adjusts for regional bias, the index reflects global momentum rather than localized spikes. Local analyses require additional datasets.
Example of End-to-End Research Workflow
You can use this research workflow.
Research Question & Conceptual Framework
| Component | Detailed Description |
| Primary Research Question | Does fraud-related search attention predict subsequent changes in complaint volumes? |
| Conceptual Premise | Search behavior reflects early awareness or exposure to scams and may function as a leading indicator of reporting behavior. |
| Hypothesis (H1) | Increases in the Scam Trend Score are positively associated with increases in complaint volumes in the following month. |
| Null Hypothesis (H0) | There is no statistically significant relationship between the Scam Trend Score and subsequent complaint volumes. |
| Independent Variable | Scam Trend Score from Civoryx |
| Dependent Variable | Monthly fraud complaint counts |
| Optional Control Variables | Media coverage volume, seasonal indicators, macroeconomic indicators |
Data Collection Plan
| Step | Procedure | Key Details |
| Collect Index Data | Retrieve monthly Scam Trend Score values | Record retrieval date and any version notes |
| Collect Complaint Data | Obtain monthly complaint totals | Include jurisdiction and reporting source |
| Define Timeframe | Select study window | Recommended 24–60 months for robustness |
| Metadata Capture | Document dataset attributes | Include definitions, release dates, and revisions |
Data Preprocessing
| Task | Actions | Purpose |
| Temporal Alignment | Convert all datasets to monthly frequency | Ensures comparability |
| Date Standardization | Use consistent date format (YYYY-MM) | Prevents merging errors |
| Missing Data Handling | Interpolate or trim periods | Maintains continuity |
| Lag Variable Creation | Create Score (t-1), optionally (t-2, t-3) | Tests predictive effects |
| Normalization (Optional) | Log or standardize complaint counts | Stabilizes variance |
Exploratory Data Analysis
| Analysis Type | Procedure | Insight Generated |
| Descriptive Statistics | Compute mean, median, SD, range | Understand distribution |
| Time-Series Visualization | Plot Score and complaints over time | Identify trends and seasonality |
| Rolling Averages | Smooth short-term volatility | Highlight underlying patterns |
| Scatterplots | Compare lagged relationships | Detect linear associations |
| Outlier Detection | Identify anomalies | Prevent distortion in models |
Statistical Analysis
| Method | Implementation | Objective |
| Correlation Analysis | Pearson or Spearman tests | Measure strength of association |
| Cross-Correlation Function | Evaluate correlations across lags | Identify optimal lag length |
| Baseline Regression | Complaintsₜ = β0 + β1(Scoreₜ₋₁) + ε | Test predictive relationship |
| Extended Regression | Add controls (media, seasonality) | Reduce omitted variable bias |
| Robustness Checks | Alternative lags and subsamples | Confirm stability of findings |
Interpretation Framework
| Aspect | Evaluation Criteria | Interpretation Goal |
| Statistical Significance | p-values and confidence intervals | Determine reliability |
| Effect Size | Magnitude of coefficient β1 | Assess practical impact |
| Model Fit | Adjusted R² and residual diagnostics | Evaluate explanatory power |
| Practical Meaning | Translate results into real-world terms | Assess policy relevance |
| Causality Caveat | Consider alternative explanations | Avoid over-interpretation |
Validation & Sensitivity Testing
| Test Type | Procedure | Purpose |
| Temporal Validation | Split into training and validation periods | Check stability over time |
| Subsample Analysis | Run models on different periods | Detect structural changes |
| Out-of-Sample Prediction | Forecast complaints using earlier data | Evaluate predictive performance |
| Sensitivity Analysis | Modify model specifications | Test robustness |
Reliability & Diagnostic Checks
| Diagnostic | Method | What It Detects |
| Autocorrelation | Durbin-Watson test | Serial correlation in residuals |
| Multicollinearity | Variance Inflation Factor (VIF) | Overlap among predictors |
| Heteroskedasticity | Residual plots or tests | Non-constant variance |
| Model Stability | Recursive estimation | Parameter drift |
Reporting & Documentation
| Element | What to Include | Purpose |
| Data Sources | Index and complaint datasets | Transparency |
| Variable Definitions | Operationalization details | Reproducibility |
| Transformations | Logs, lags, normalization | Method clarity |
| Model Specifications | Equations and assumptions | Replication |
| Limitations | Data and methodological constraints | Balanced interpretation |
Presentation of Results
| Output Type | Recommended Content | Benefit |
| Tables | Descriptive stats, correlations, regressions | Clear numerical summary |
| Figures | Time-series plots and forecasts | Visual interpretation |
| Narrative Summary | Plain-language explanation | Accessibility |
| Appendix | Technical diagnostics and code | Reproducibility |
Ethical Considerations
| Principle | Application |
| Aggregated Data Use | Emphasize non-identifiable nature of search data |
| Interpretation Caution | Avoid equating attention with victimization |
| Transparency | Clearly state assumptions and limitations |
| Responsible Framing | Use neutral, non-stigmatizing language |
Final Research Outputs
| Deliverable | Description |
| Empirical Findings | Statistical relationship between attention and complaints |
| Methodological Contribution | Demonstration of search-based indicators in fraud research |
| Policy Insight | Implications for early warning systems |
| Reproducible Materials | Data documentation and code |
| Future Research Directions | Suggestions for further validation |
How to Write About Civoryx in Academic Papers?
When describing the index, include:
- Its nature as a search-based composite indicator
- The use of TrendWeight™ for regional adjustment
- The number of keywords tracked
- The retrieval date
Want an example method prescription? Here it is: “The study uses the Civoryx Global Fraud Index, a composite measure of fraud-related search attention derived from month-over-month changes across more than 150 keywords, weighted by search volume and adjusted for regional bias using TrendWeight™.”
Although the index uses aggregated data, researchers should:
- Avoid attributing behavior to individuals
- Clearly distinguish attention from victimization
- Use neutral language to prevent stigma
Transparency about limitations is key to ethical scholarship.
Why Civoryx Matters in Fraud Research
Fraud is a rapidly adapting phenomenon, shaped by technology adoption, economic conditions, and social behavior. Traditional data sources often capture only the aftermath. Civoryx provides a complementary lens — one that reveals how awareness and exposure evolve in real time.
Its open-access model also lowers barriers to entry, enabling smaller institutions and independent researchers to study fraud dynamics without expensive datasets.
Conlusion
Using the Global Fraud Index for academic research offers a powerful way to observe the shifting landscape of online fraud. By combining real-time search behavior with rigorous analytical methods, researchers can:
- Detect emerging scam patterns earlier
- Contextualize incident data
- Explore the relationship between awareness and harm
Civoryx was built on a simple premise: fraud evolves faster than headlines. For scholars, that means understanding fraud requires tools that move at the same speed. With its transparent methodology, composite scoring, and TrendWeight™ regional adjustment, the Global Fraud Index provides a practical foundation for studying one of the most dynamic forms of digital risk.